




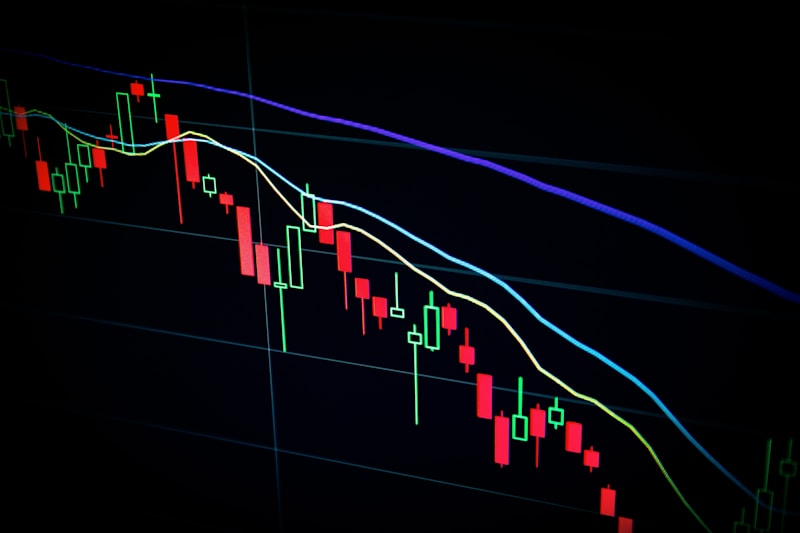
Lagging Indicators
Lagging indicators are economic or financial metrics that reflect past trends and are used to forecast future economic activity. They are called "lagging" because they react to changes in the economy after they have occurred, often with a delay of several months or even years. Lagging indicators are used by economists, investors, and policymakers to gauge the overall health of an economy and make informed decisions.
Lagging indicators are often contrasted with leading indicators, which are economic metrics that tend to predict future economic activity. The combination of leading and lagging indicators provides a more comprehensive picture of the economy and helps to identify potential turning points in the business cycle. Examples of lagging indicators include the unemployment rate, inflation rate, and industrial production.
The use of lagging indicators dates back to the early 20th century, when economists such as Walter Bagehot and Arthur Pigou began to develop and apply these metrics to understand economic trends. Today, lagging indicators are widely used in economics and finance to analyze and forecast economic activity.
History
The concept of lagging indicators emerged in the early 20th century, when economists began to develop and apply metrics to understand economic trends. One of the earliest examples of a lagging indicator is the unemployment rate, which was first used by the US government in the 1930s to track the impact of the Great Depression. The unemployment rate was initially calculated as a percentage of the labor force, and it was used to gauge the overall health of the economy.
In the 1950s and 1960s, economists such as Milton Friedman and Simon Kuznets developed and refined the concept of lagging indicators. They recognized that lagging indicators could provide valuable insights into the economy, but they also acknowledged that these metrics were subject to various limitations and biases.
Mechanism
Lagging indicators work by reflecting past trends and patterns in economic activity. They are often based on historical data, such as GDP growth rates, inflation rates, and employment levels. The delay between the occurrence of an economic event and the reflection of that event in a lagging indicator is known as the "lag" period.
The lag period can vary depending on the specific indicator and the economy being analyzed. For example, the unemployment rate may reflect changes in the labor market with a lag of several months, while the inflation rate may reflect changes in prices with a lag of several years.
Applications
Lagging indicators are widely used in economics and finance to analyze and forecast economic activity. They are used by economists, investors, and policymakers to gauge the overall health of an economy and make informed decisions.
Some common applications of lagging indicators include:
* Business cycle analysis: Lagging indicators are used to identify the phases of the business cycle, including expansion, peak, contraction, and trough.
* Economic forecasting: Lagging indicators are used to forecast future economic activity, including GDP growth rates, inflation rates, and employment levels.
* Policy evaluation: Lagging indicators are used to evaluate the effectiveness of economic policies, such as monetary policy and fiscal policy.
Criticism and Controversy
Lagging indicators have been subject to various criticisms and controversies over the years. Some of the limitations and biases of lagging indicators include:
* Lag period: The delay between the occurrence of an economic event and the reflection of that event in a lagging indicator can make it difficult to use these metrics for real-time analysis and forecasting.
* Data quality: The quality of the data used to calculate lagging indicators can be a major concern. Poor data quality can lead to inaccurate or misleading results.
* Interpretation: Lagging indicators can be subject to various interpretations, which can lead to disagreements among economists and policymakers.


